By Sven Mayer and Guo Freeman
In our previous blog post, we provided insights into the Paper Track Program Committee, comprising 1,203 individuals: 4 Paper Chairs, 55 Subcommittee Chairs (SC), 34 assistants who help with various tasks, and 1,110 Associate Chairs (AC). However, those insights still do not capture the full picture of the massive peer review process for the CHI paper track, where a large number of external reviewers outside the program committee play a significant role.
In this blog post, we aim to provide additional insights into paper track reviewing, excluding the subcommittee chairs and paper chairs, but focusing on ACs and external reviewers who submitted written reviews.
Reviews by Location of Affiliation and Submissions vs. Reviews
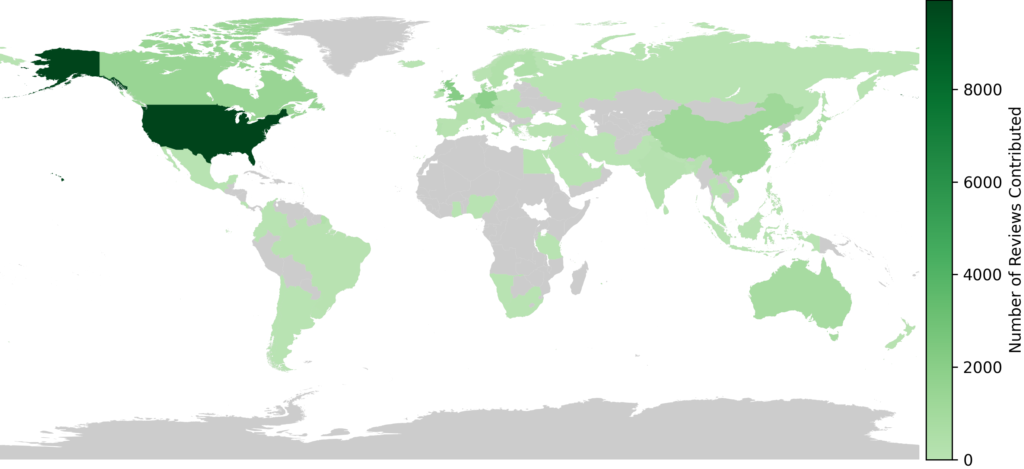
As shown in Figure 1, overall, reviewers affiliated with institutions in the USA contributed the most reviews to the paper track, followed by China. This is similar to what we reported in our previous blog post about the paper track program committee,
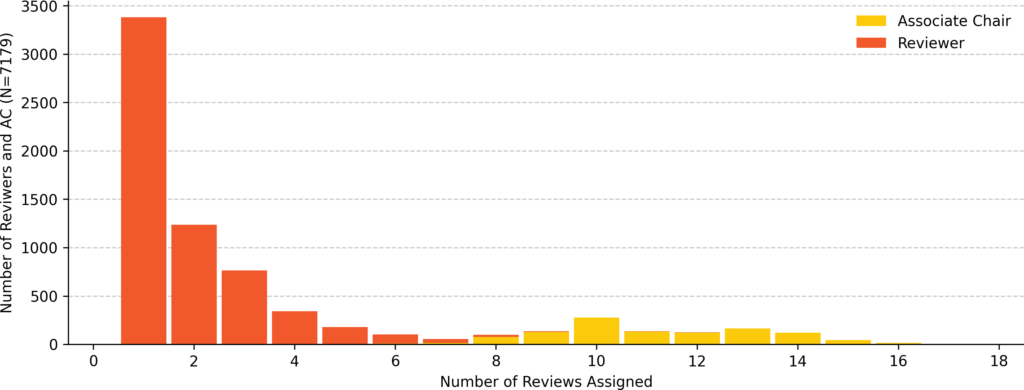
Number of Assigned Papers per Individual
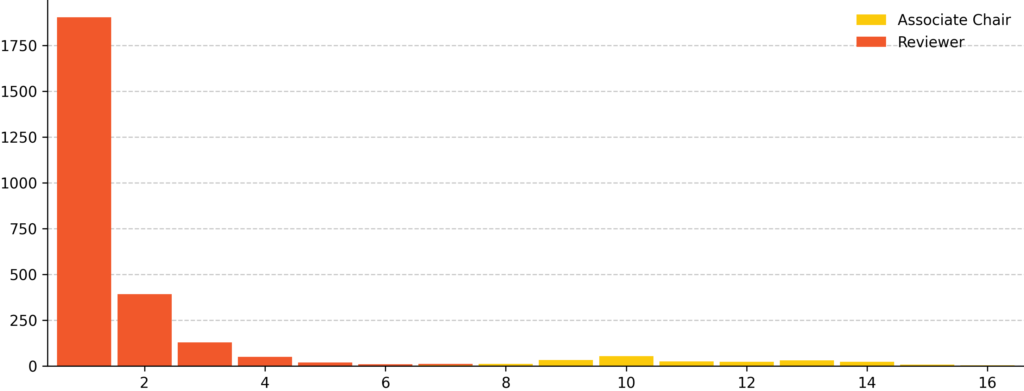
In total, 7,179 individuals contributed reviews in a written form to the CHI 2026 paper track, 6,069 of whom were external reviewers (i.e., individuals who are not part of the program committee) and 1110 as Associated Chairs (AC). They wrote a total of 24,099 reviews. ACs contributed a total of 12,551 reviews with a mean of 11.31 (SD = 2.19, min = 4, max = 19) reviews assigned. Reviewers contributed a total of 11,548 reviews with a mean of 1.90 (SD = 1.35, min = 1, max = 12) reviews assigned. See Figure 2.
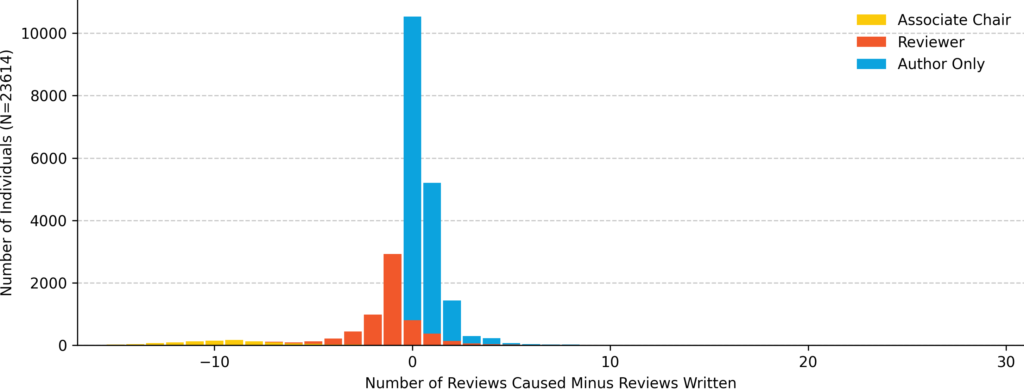
Did Authors Actually Review?
Whether our peer review process at CHI is functional and sustainable depends on whether our peers actually review. Therefore, we investigated whether the submitting authors actually reviewed in this year’s paper track. Each submission to the CHI 2026 paper track needs 4 reviews (one 1AC, one 2AC, and two external reviews). In this sense, if the reviewing load was balanced across the community for each submitted paper, the authors would need to contribute a total of 4 reviews.
According to an earlier blog post, “CHI’26 Insights Into Submitting Authors of the Papers Track,” CHI’26 has 20,972 unique authors. At the same time, only 7,177 individuals contributed reviews to the paper track. When we consider that papers have, on average, 5.0 authors (SD = 3.0, min = 1.0, max = 46.0), and assuming a fair balance, this already indicates that there should be more individual reviews.
For each paper submitted, we assigned a cost of 4/n to each author, since they together contributed 4 reviews to the community. On the positive side, we counted each review. With this, we can calculate the difference between the reviews produced by submitting (i.e., cost) and the reviews contributed. Figures 3 and 4 show this difference. Here, we have three groups: Associate Chairs, Reviews, and Authors Only. Associate Chairs (N = 1,110) have, on average, -8.66 (SD = 3.51) fewer reviews assigned than their author share. However, 24 ACs have fewer reviews delivered than they caused due to their submissions. Reviewers (N = 6,069) have, on average, -0.80 (SD = 1.77) more reviews assigned than their author share. However, 1,181 Reviewers have fewer reviews delivered than they caused due to their submissions. Furthermore, 16,465 authors did not review at all, who should have, on average, 1.05 (SD = 1.02) reviews assigned but did not review. Why these authors did not review might be due to various reasons and factors, which were not reflected in our data. Authors who only contributed to one paper (N = 13,719) should have, on average, 0.81 (SD = 0.47, min = 0.09, max = 4.00) reviews assigned but did not review. Then, we have authors who contributed to multiple papers (N = 2,746) who should have, on average, 2.22 (SD = 1.85, min = 0.41, max = 30.00) reviews assigned but did not review. Finally, we have the extreme cases: authors who contributed to more than 10 papers (N = 33) who should have, on average, 12.26 (SD = 6.12, min = 5.98, max = 30.00) reviews assigned but did not review.
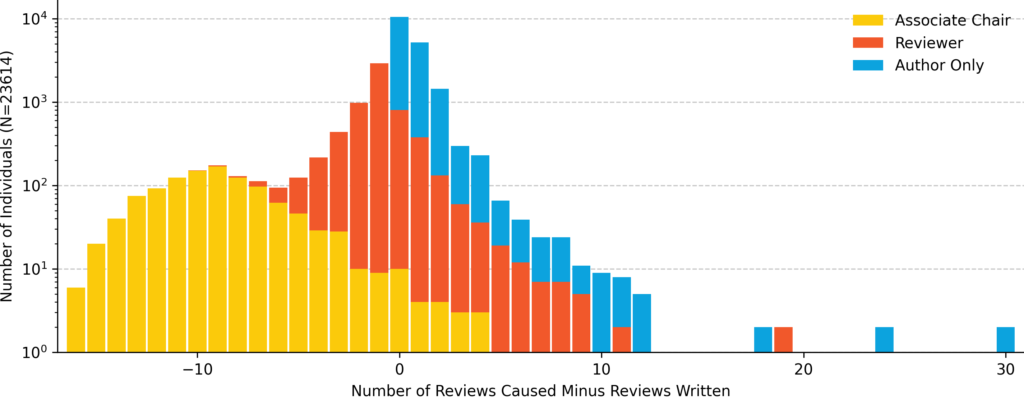
This pattern aligns with earlier investigations, such as those at CHI 2016 and CHI 2023. Based on these, a concerning observation seems to be: even 10 years later, a portion of authors who constantly submit to the CHI paper track are still not reviewing.
Authors who Made Abundant Submissions But Do Not Review
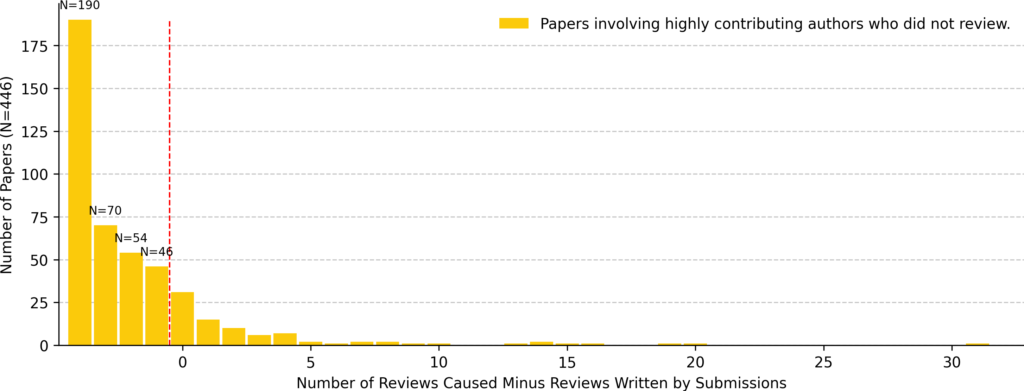
Next, we look at the authors who contributed to more than 10 papers (N = 33) but did not review. In total, these 33 individuals co-authored 446 papers (6.6% of all submissions). These authors indeed have co-authors who could make up for the missing reviews. In fact, they have 2,786 co-authors and contributed a total of 5,136 reviews. However, they themself have multiple papers. Therefore, they should contribute equally to all of their submissions with respect to reviews. With this, 1,106.3 reviews need to be covered for the 446 papers. However, at 4 reviews per paper, we need 1784 reviews. This gives us the first indication that authors who submit many papers but do not review at all result in other people needing to review more than they caused.
Additionally, when we examine the distribution of papers (Figure 5), the problem is even larger. Some individuals who contribute many reviews but do not submit a large number themselves would compensate for someone else’s loss (i.e., an author who submitted many papers but did not review). In fact, Figure 5 shows that 422 papers (out of the 446 authored by individuals who submitted more than 10 papers) did not fulfill their due for peer review when an individual who made abundant submissions did not review. In contrast, some authors contributed 35 reviews, even though they were only required to do 4. As a result, we have seen a consistent and concerning pattern in our community: authors who make abundant submissions but do not review impose an additional, unfair burden on peers and colleagues, requiring them to review more than their fair share.
The Heros
In contrast, we also have the heroes who sustain and carry out our peer review system despite some authors not contributing any reviews (Figure 6). This year, 2,748 external reviewers and ACs (11.6% of all external reviewers and ACs) did not submit any papers but contributed reviews. These reviewers and AC wrote 5,960 (24.7%) reviews in total. Specifically, 217 ACs who did not submit but wrote 2,418 reviews, and 2,531 external reviewers did not submit but wrote 3542 reviews. We extend our sincere and special thanks to these hero ACs and reviewers for their generous help for the CHI 2026 paper track.
Review Length
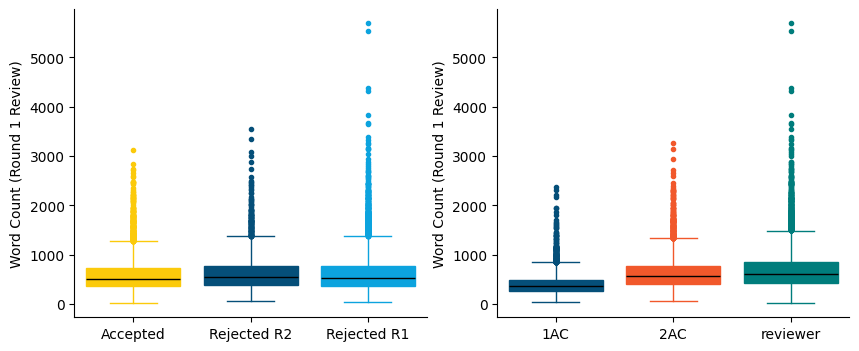
Next, we look at the length of written reviews to CHI’26 paper track. While length is not an absolute measure of quality, short reviews cannot convey the same level of detail as long ones. Figure 7 shows the difference in the length of the initial review (round 1) by paper decision (i.e., accept, rejected in round 1, and rejected in round 2) and reviewer role: 1AC (who often only need to provide a meta review), 2AC (who would provide a detailed, in-depth review of the paper), and external reviewers (who would provide a detailed, in-depth review of the paper).
For the accepted papers, the review word count has a mean of 580 (SD=329), a median of 508, a minimum of 16, and a maximum of 3129. For the reviews of papers that were Rejected R2 (rejected in round 2), the word count has a mean of 626 (SD=363), a median of 545, a minimum of 59, and a maximum of 3552. For the reviews of papers that were Rejected R1 (rejected in round 1), the word count has a mean of 612 (SD=371), a median of 531, a minimum of 40, and a maximum of 5691. A Kruskal-Wallis test showed a statistically significant difference in review length by decision (H = 38.80, p < 0.001). Dunn post hoc test revealed differences between all groups (all p < 0.05). Thus, papers rejected in the first round receive the longest reviews, while accepted papers receive the shortest. This is reasonable, as reviewers may feel that a more detailed review would be essential to help authors of rejected papers identify limitations and future improvements of their work. Regarding 1AC reviews, the word count has a mean of 403 (SD=212), a median of 363, a minimum of 40, and a maximum of 2381. Regarding 2AC reviews, the word count has a mean of 637 (SD=326), a median of 575, a minimum of 63, and a maximum of 3258. Regarding reviews done by external reviewers, the word count has a mean of 689 (SD=391), a median of 603, a minimum of 63, and a maximum of 5691. A Kruskal-Wallis test showed a statistically significant difference in review length by role (H = 3330.59, p < 0.001). Dunn post hoc test revealed differences between all groups (all p < 0.001). Therefore, external reviewers write the longest reviews and 1AC the shortest. This is reasonable, as 1AC’s main role is to recruit two external reviewers, coordinate with 2AC, and manage discussion and decision-making among all reviewers, and deliver the final recommendation in the form of a synthesized meta review, rather than writing a detailed review of the paper themselves.
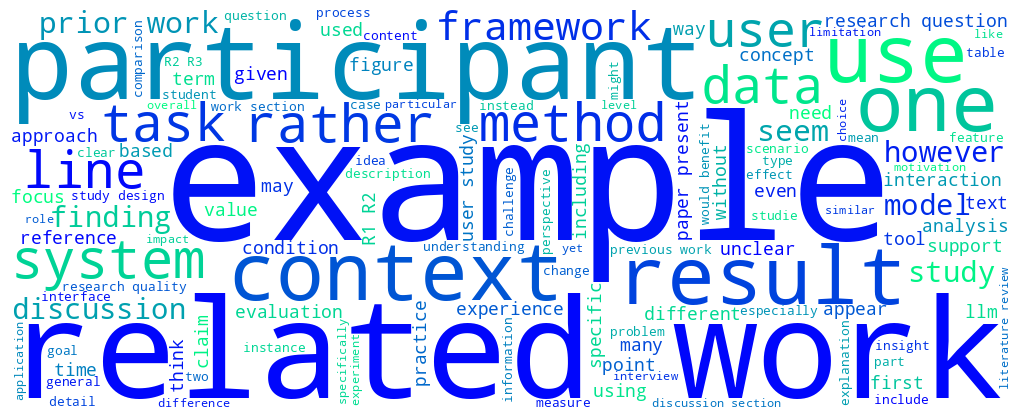
Review Content
To provide a high-level overview of review content, we performed a TF-IDF analysis of the Round-1 review texts (N = 18120 reviews) after removing stop words and normalizing word forms. We then compared the average TF-IDF scores for reviews of accepted papers and rejected papers in Round 1 to identify terms that were particularly characteristic of each group. The most distinctive terms in reviews of accepted papers include, well, revision, minor, resubmit, clarify, address, accept, rr, solid, clarification, carefully, request, enjoy, or strong. In contrast, reviews of papers rejected in Round 1 more often contained words such as reject, unclear, rejection, lack, unfortunately, venue, claim, however, ready, topic, rrx, hope, current, limited, or continue. Figures 8 and 9 provide insights into the most frequently used words in the reviews.