By Sven Mayer and Guo Freeman
This year, CHI’s paper track program committee comprises 1203 individuals from around the world, including four Paper Chairs, 55 Subcommittee Chairs (SC), 34 assistants who help with various tasks, and an impressive number of 1110 Associate Chairs (AC).
In this blog post, we provide insights into the paper track program committee, who volunteered their valuable time to ensure a high-quality paper review process for CHI, including the tremendous yet often invisible efforts to recruit quality ACs for CHI, as well as ACs’ locations of affliction and workload.
AC Recruitment Efforts and Outcomes
As previously highlighted in our blog post, “Insights Into the Papers Track First Round Outcomes,” we have observed significant increases in submissions to the CHI paper track over the past several years. However, what is often unknown to the public is the tremendous but often invisible efforts required to recruit a sufficient number of high-quality ACs to manage this overwhelming volume of submissions.
To help the community better understand these efforts, we first explain how paper chairs and subcommittee chairs work closely together in several ways to recruit ACs for the CHI full papers track. First, paper chairs provide subcommittee chairs with historical data on ACs’ past service, including how many years someone has served, in which years, their affiliation (academia or industry), region, and self-reported pronouns. Paper chairs also provide each subcommittee with a projected/suggested number of ACs based on the history of submission numbers to each subcommittee; then subcommittee chairs are responsible for recruiting a number of ACs for their own subcommittee that is close to or meet the projected number (e.g., if the projected number is 45, then the subcommittee chair should recruit 45 or close to 45 ACs). Second, community members can volunteer through PCS and provide similar background information. Paper chairs then share the list of volunteers with subcommittee chairs, who can invite volunteers from the list to serve as ACs based on how well their experience and expertise match the specific subcommittee. Third, subcommittee chairs may directly invite individuals to balance a wide range of attributes, such as experience, disciplinary background, institutional context, and geographic representation.
It is important to note that paper chairs and subcommittee chairs must anticipate and plan for capacity issues in the AC recruitment process. For example, given last year’s 24% growth in submissions to the CHI full papers track, the AC pool for the CHI 2026 full papers track would need to expand by a similar percentage if no existing members stepped down. At the same time, maintaining long-term stability in the review process is essential, and inviting experienced ACs helps preserve institutional knowledge and consistent evaluation standards. From a scientific perspective, diversity of expertise is equally critical. This ensures coverage of a broad range of methods and topical domains so that all submissions can be reviewed by knowledgeable experts. Finally, AC recruitment also seeks to reflect the breadth of the international CHI community and ensure that a wide range of voices and perspectives are represented.
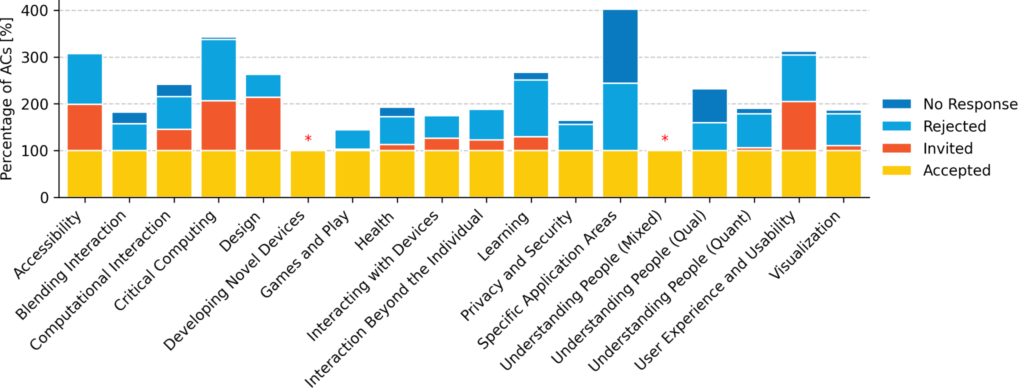
Next, we unpack AC recruitment efforts and outcomes per subcommittee. As a reminder, the CHI’26 paper track has 18 subcommittees (shown on the x-axis of Figure 1). On average, subcommittees have 61.7 ACs. Design has the highest number of ACs (N=100), while Developing Novel Devices has the lowest (N=26). As we will see later in Figure 4, the number of ACs is not proportional to the number of papers submitted to the subcommittees. As mentioned above, subcommittees must anticipate and plan for capacity issues in the AC recruitment process. Therefore, each year, the subcommittees predict CHI’s growth and, in particular, their subcommittee’s growth, using a fixed growth percentage of around 24% weighted by the subcommittee’s actual growth in 2025.
The subcommittee chairs are also responsible for AC recruitment, and they track their efforts. Thus, we can get insights into how well AC recruitment worked for CHI’26. All subcommittees but “Developing Novel Devices” and “Understanding People (Mixed)” have provided numbers on this. Assuming that each subcommittee needs 100% of the projected number of ACs to meet their demand, as shown in Figure 1, we see that more than half of the SCs send out at least 200% more invites to cover their needs (e.g., if the projected number of ACs is 45, they need to send out at least 90 invites). In fact, Special Application Areas sent out 402.1% of the required invites: they needed 48 ACs but sent 193 invitations. However, 76 candidates were invited but did not respond, and 67 simply declined the invite. The actual number is higher because ACs frequently move between subcommittees, leading them to accept one subcommittee and reject another.
ACs by Location of Affiliation
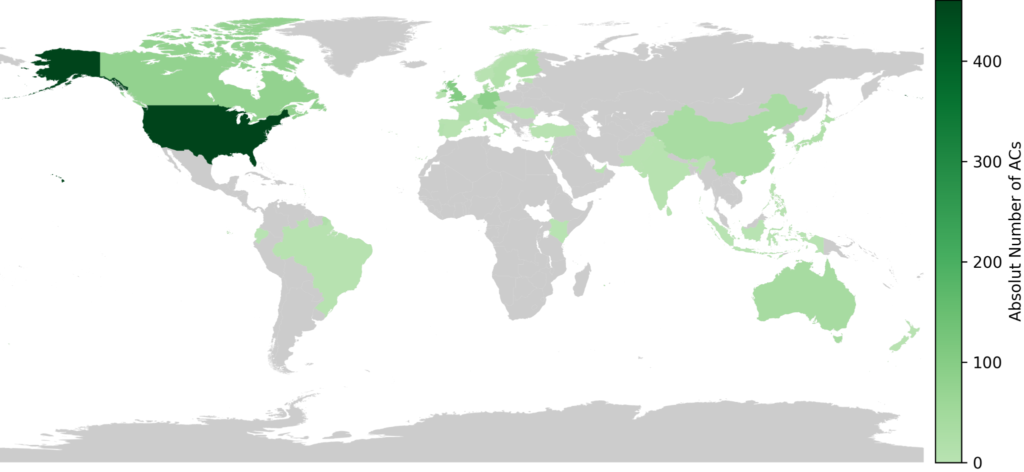
We then examine the overall distribution of Associate Chairs by the location of their affiliation, as we did in our previous blog post about the submitting authors of the papers track. This is reflected in Figure 2. Here, we see that the majority of ACs for the CHI’26 paper track are located in the United States of America.
ACs vs. Paper Submissions
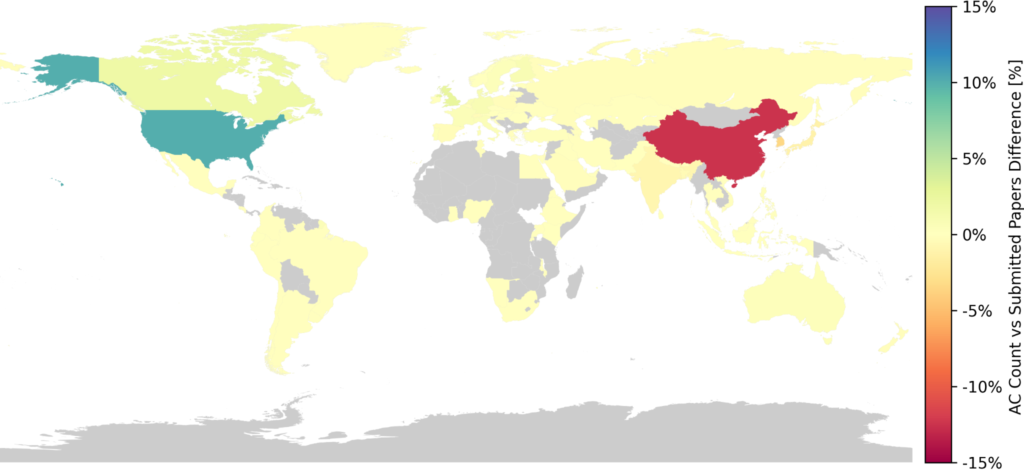
Looking back at our blog post featuring submitting authors at CHI’26, Figure 1 presents a picture that does not align with the global distribution of the submitters. This indicates that the authors who submitted the most to the conference are not equally represented in the program committee. Figure 3 shows the difference between the proportion of ACs vs the proportion of paper submitters based on their affiliation location.
On the one hand, the USA shows a proportion difference of 10% between ACs and submitted papers, as they contributed more ACs (41.5%) than papers (31.5%). On the other hand, China shows an opposite proportional difference between ACs and papers of -12.5%, as the AC pool had a proportionally lower presence from this country (ACs 3.2% vs paper submissions 15.7%).
Number of Assigned Papers per Associate Chair
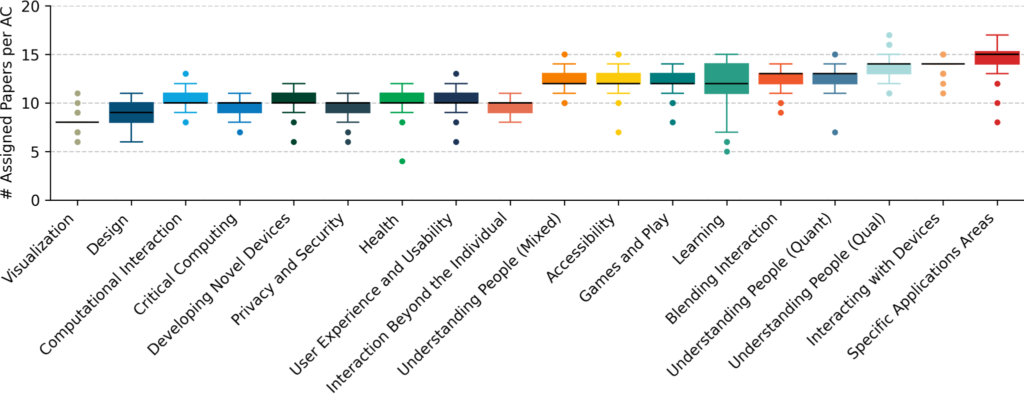
For CHI 2026 and prior CHIs, the subcommittee chairs had the option to run their subcommittee with a different number of assigned papers per AC, mainly based on (1) how many ACs they could recruit, and (2) how many submissions the subcommittee received in total. They had the option to aim for 10, 12, or 14 papers per AC. That is, 1AC + 2AC reviews combined, such as managing 7 papers as 1AC and 7 papers as 2AC, totaling 14 papers. Table 1 shows the target number of papers assigned to each AC across subcommittees. Thus, how subcommittees recruit ACs and their plans for running the subcommittee can lead to differences in the number of papers an AC handles. Figure 4 shows the box plot of the number of assigned papers per AC for each subcommittee. As shown in Table 1, Visualization has the lowest load with an average of 8 papers per AC (i.e., 1AC + 2AC papers combined), while Specific Application Areas has the highest number of papers per AC, at 14.7. We note that desk rejections initiated by ACs are excluded from this count, as ACs have been unassigned once the desk rejection was approved by the paper chairs. However, for the subcommittee with the lowest assigned papers – Visualization – they only had 9 desk rejections. Therefore, the overall picture does not change drastically. See the full desk rejection blog post for details.
| Target | Mean | SD | Min | Max | |
|---|---|---|---|---|---|
| Visualization | 10 | 8.0 | 0.8 | 6.0 | 11.0 |
| Design | 10 | 8.9 | 0.9 | 6.0 | 11.0 |
| Privacy and Security | 10 | 9.5 | 0.9 | 6.0 | 11.0 |
| Critical Computing | 12 | 9.7 | 0.8 | 7.0 | 11.0 |
| Interaction Beyond the Individual | 10 | 9.7 | 0.7 | 8.0 | 11.0 |
| Health | 10 | 10.0 | 1.0 | 4.0 | 12.0 |
| Developing Novel Devices | 10 | 10.2 | 1.3 | 6.0 | 12.0 |
| User Experience and Usability | 14 | 10.3 | 1.1 | 6.0 | 13.0 |
| Computational Interaction | 14 | 10.4 | 1.0 | 8.0 | 13.0 |
| Learning | 12 | 12.1 | 2.2 | 5.0 | 15.0 |
| Games and Play | 14 | 12.2 | 1.5 | 8.0 | 14.0 |
| Understanding People (Mixed) | 10 | 12.2 | 1.0 | 10.0 | 15.0 |
| Understanding People (Quant) | 14 | 12.5 | 1.1 | 7.0 | 15.0 |
| Accessibility | 12 | 12.5 | 1.4 | 7.0 | 15.0 |
| Blending Interaction | 14 | 12.6 | 1.0 | 9.0 | 14.0 |
| Understanding People (Qual) | 14 | 13.8 | 1.3 | 11.0 | 17.0 |
| Interacting with Devices | 10 | 13.9 | 0.7 | 11.0 | 15.0 |
| Specific Application Areas | 14 | 14.7 | 1.5 | 8.0 | 17.0 |