By Sven Mayer and Guo Freeman
Traditionally, we only learn about the many authors who get their CHI submissions accepted and published. However, this does not provide a comprehensive understanding of the global HCI community and our ongoing efforts to advance HCI research. Therefore, we believe that examining who submits to CHI is extremely valuable for gaining insights into the community’s distribution and evolution worldwide. In this blog post, we provide detailed information about submitting authors of the papers track at CHI 2026, including: the location of the authors’ affiliations, the number of authors per submitted paper, submissions by country per subcommittee, and the number of submitted papers per author.
Another potential factor that may affect where submitting authors have their primary affiliation is the location of CHI. Therefore, when reading this post, please note that CHI is taking place in Spain on the Iberian Peninsula in 2026. At the same time, we need to acknowledge that we also have people in the community who do not submit to CHI (or do not submit every year). Addressing both factors will require a cross-year effort to gain a more holistic understanding.
Submitting Authors by Location of Affiliation
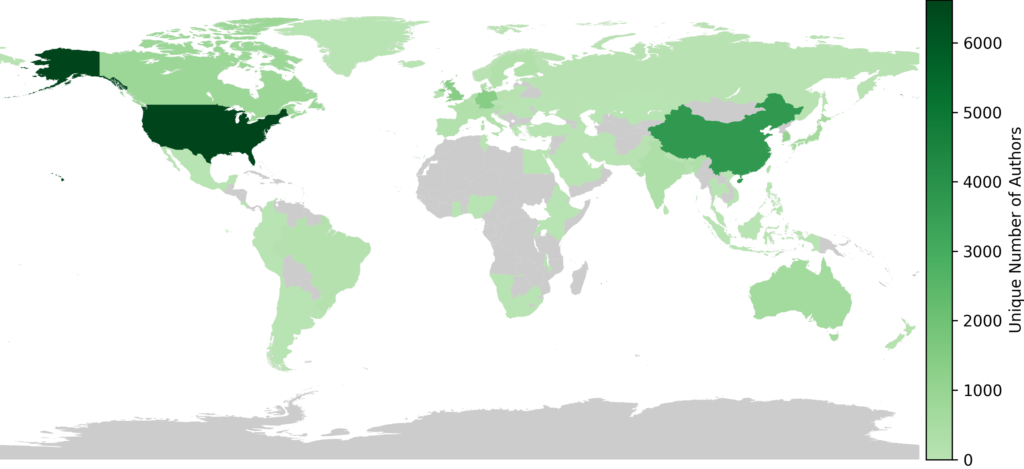
First, we provide a comprehensive understanding of the submitting authors worldwide by the location of their affiliations. For this, we analyze the 6,725 valid submitted papers (excluding withdrawn papers), where we look at the number of unique authors. This year, 20,896 unique authors submitted to CHI. The vast majority of authors stated that they had affiliations in only one country (20511 authors). Only 380 have affiliations in two different counties, and 5 authors have affiliations in three counties. After normalizing for this, we present the distribution of the submitting authors’ affiliation origins, as shown in Figure 1 and Table 1. In total, authors submitted with affiliations from 87 different countries.
Number of Authors per Submitted Paper
The raw number of authors per country would not be accurate if there were a bias in the number of authors per paper. Therefore, we look further into the number of authors per paper, as shown in Figure 2.
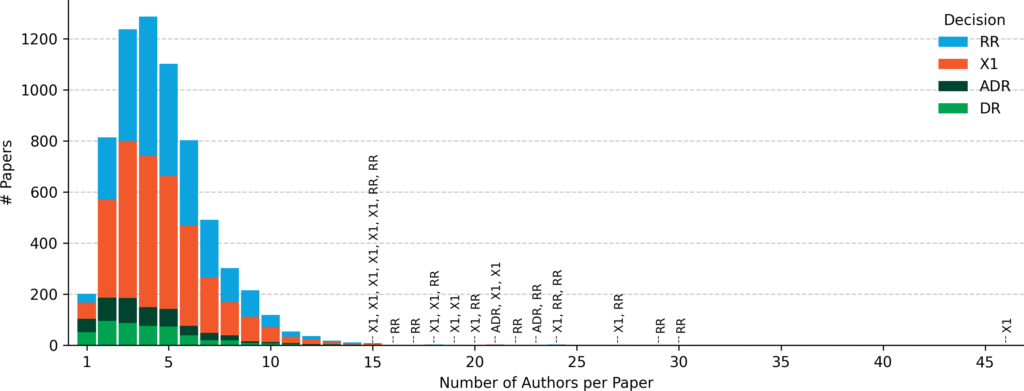
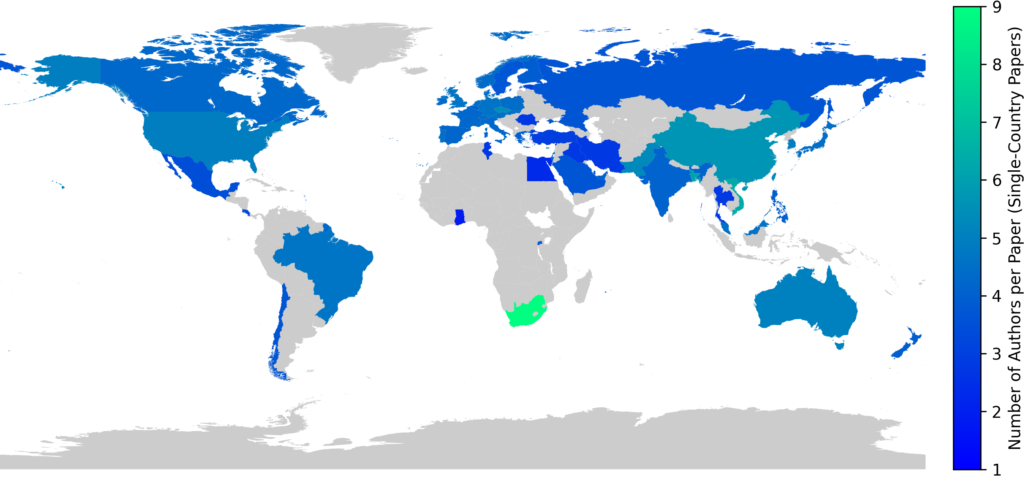
Considering this distribution, Figure 1 would skew if there is an impact of country on the distribution. In fact, this has been demonstrated in a previous blog post for MobileHCI. Therefore, we also need to examine the average number of authors per paper by country, as shown in Figure 3. For this, we only consider papers written by authors affiliated with a single origin (4,566 papers have authors only from one country). A Kruskal-Wallis H-test confirms statistically significant differences in the number of authors across countries (H(58, n=4566) = 324.355, p<.001) based on papers submitted by authors from a single country (67.9% of all papers).
Origin of Submitted Papers
Recognizing that the number of authors per paper varies by country, we now need to revisit the origin of authors to understand where the fewest and most papers come from. This allows us to map the number of submissions per geographical location (country), as shown in Figure 4 and Table 1. However, keep in mind that this does not yet take into account the relative size and economic status of a country.
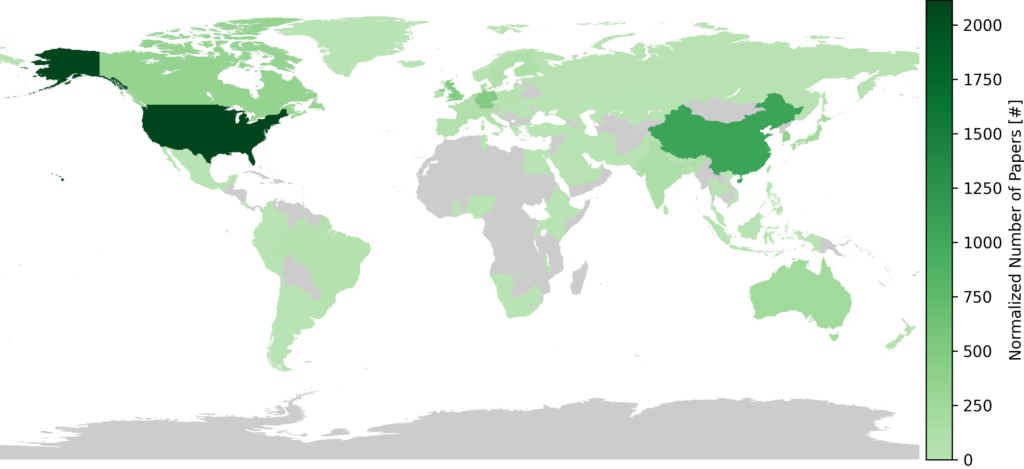
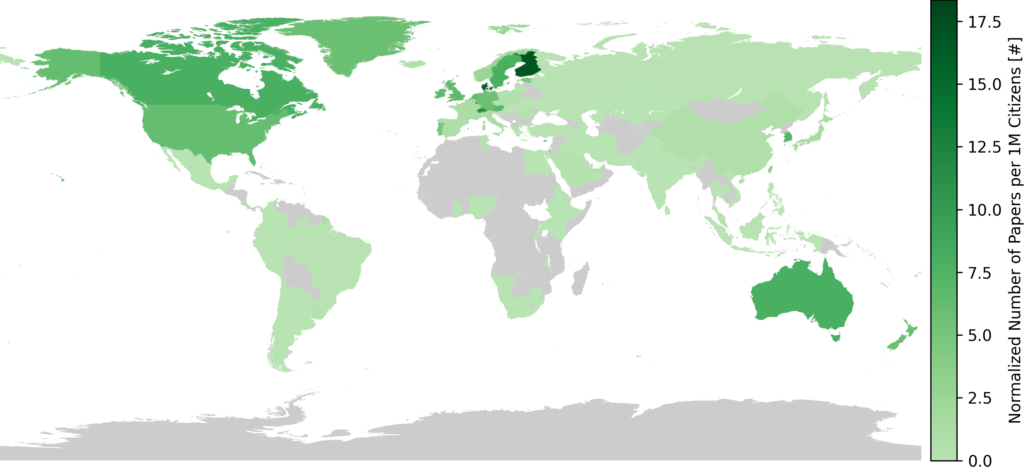
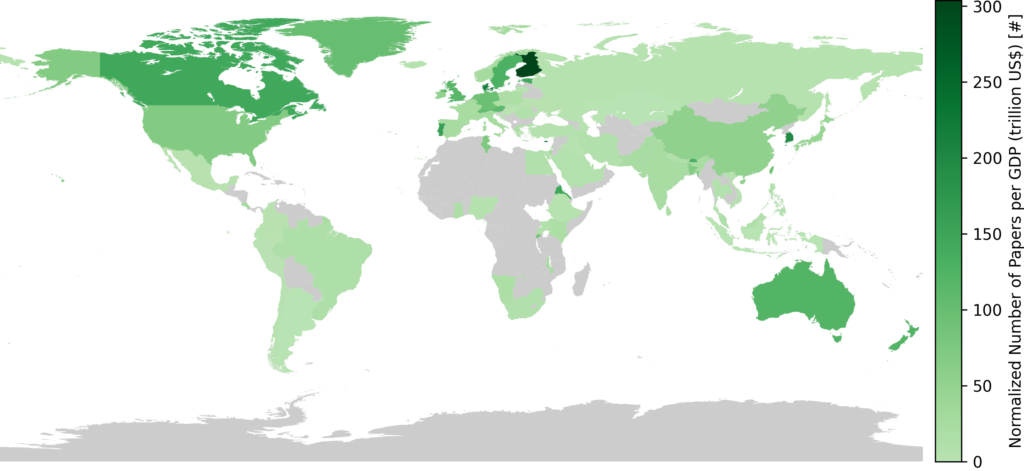
Now, this view is distorted as not all counties are the same size (e.g., in terms of citizens). Thus, considering the population of the counties is important. For this, we rely on the data collected on Wikipedia. Figure 5 shows the number of normalized papers per million citizens. Another way to look at this is through the gross domestic product (GDP), e.g., the efficiency of spending the GDP on submitting CHI papers. For this, we rely on the IMF data (Retrieved 24 October 2025). Figure 6 shows the outcome for each country. All numbers are also presented in Table 1.
Submissions by Country per Subcommittee
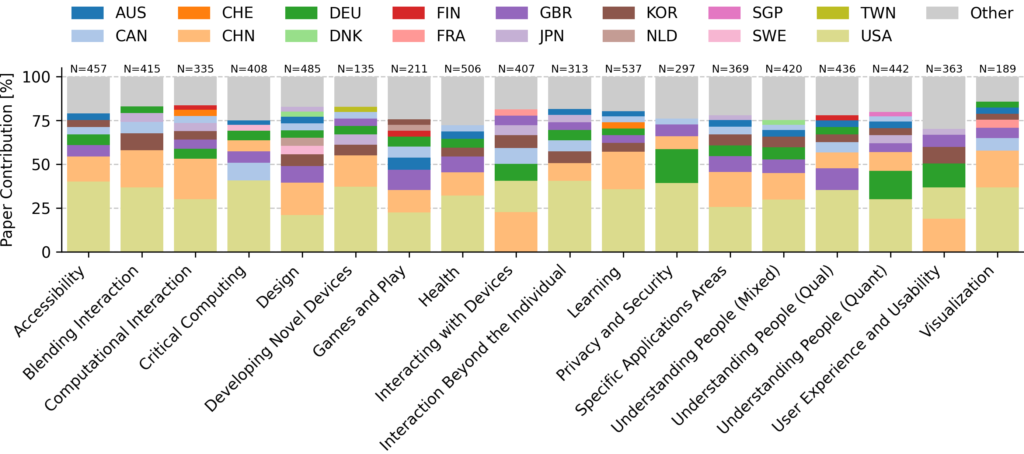
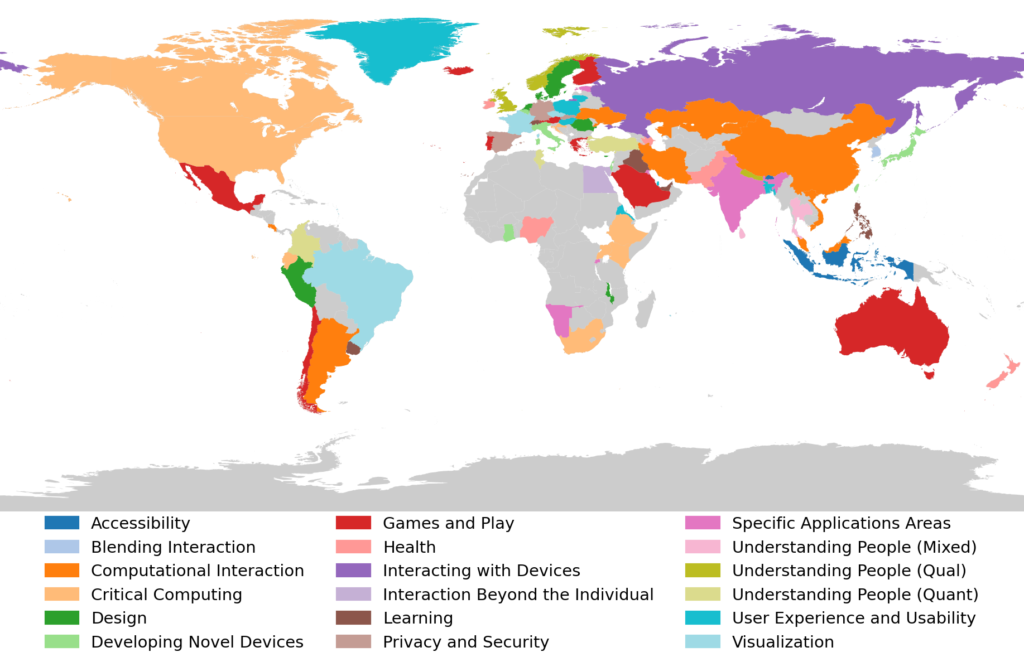
Next, we look into which subcommittee the authors submitted to based on the country of their affiliation. However, subcommittees do not have the same number of submissions. After normalizing for that, Figure 7 shows which country submits to which subcommittee the most. Figure 8 further maps countries and the subcommittees to which they submit the most papers, respectively.
Number of Submitted Papers per Author
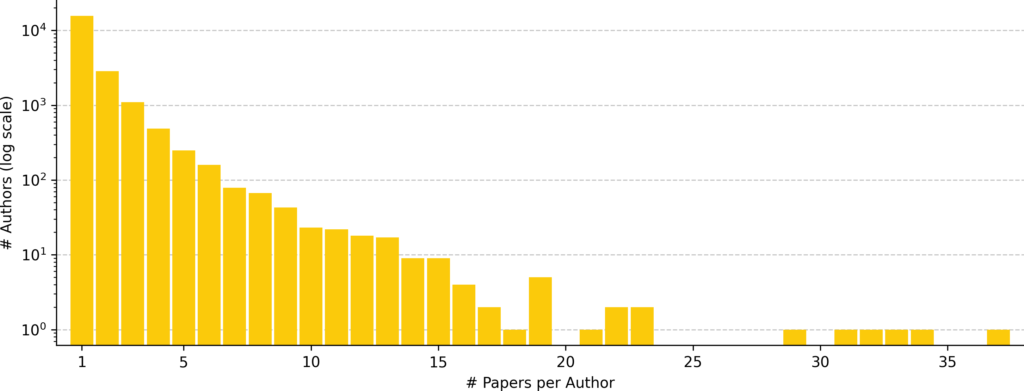
Of the 20,972 unique authors, each submitted on average 1.53 papers (SD = 1.48). However, most authors (N = 15,831) contributed to only one paper. Only 470 authors submitted more than 5 papers, 96 submitted more than 10 papers, and 11 authors submitted more than 20 papers. Figure 9 shows the full distribution.
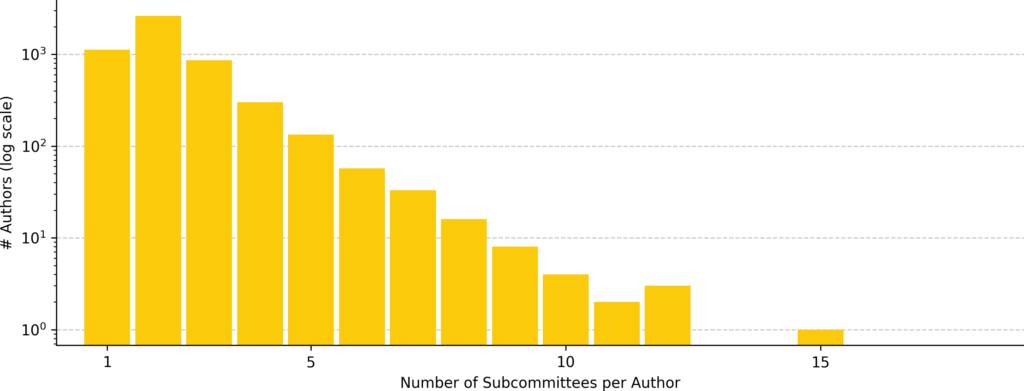
Authors who submitted more than one paper can also submit to different subcommittees. Figure 10 shows the distribution of the number of subcommittees per author. On average, these authors submitted to 2.2 subcommittees (SD = 1.2), with most (N = 2,565) submitting to two subcommittees. One author submitted to 15 out of the 18 different subcommittees at CHI 2026.
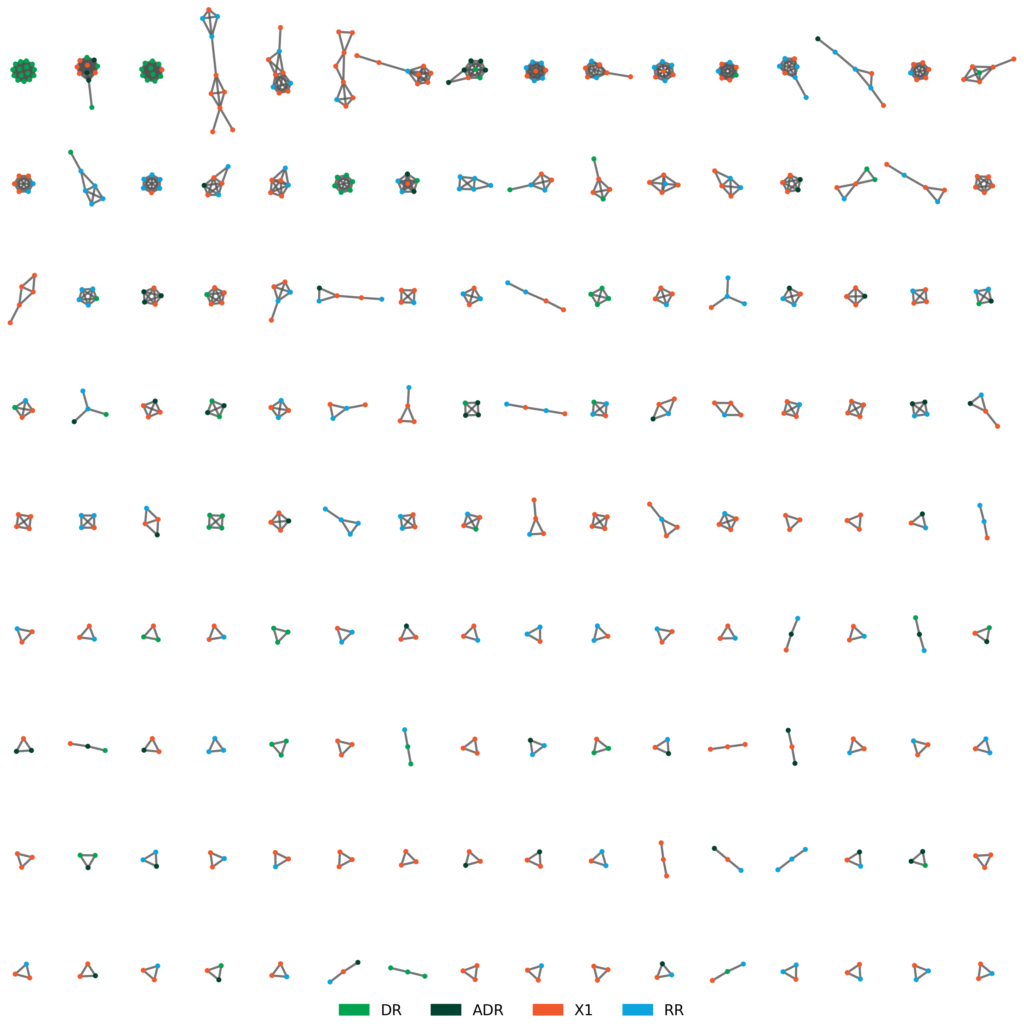
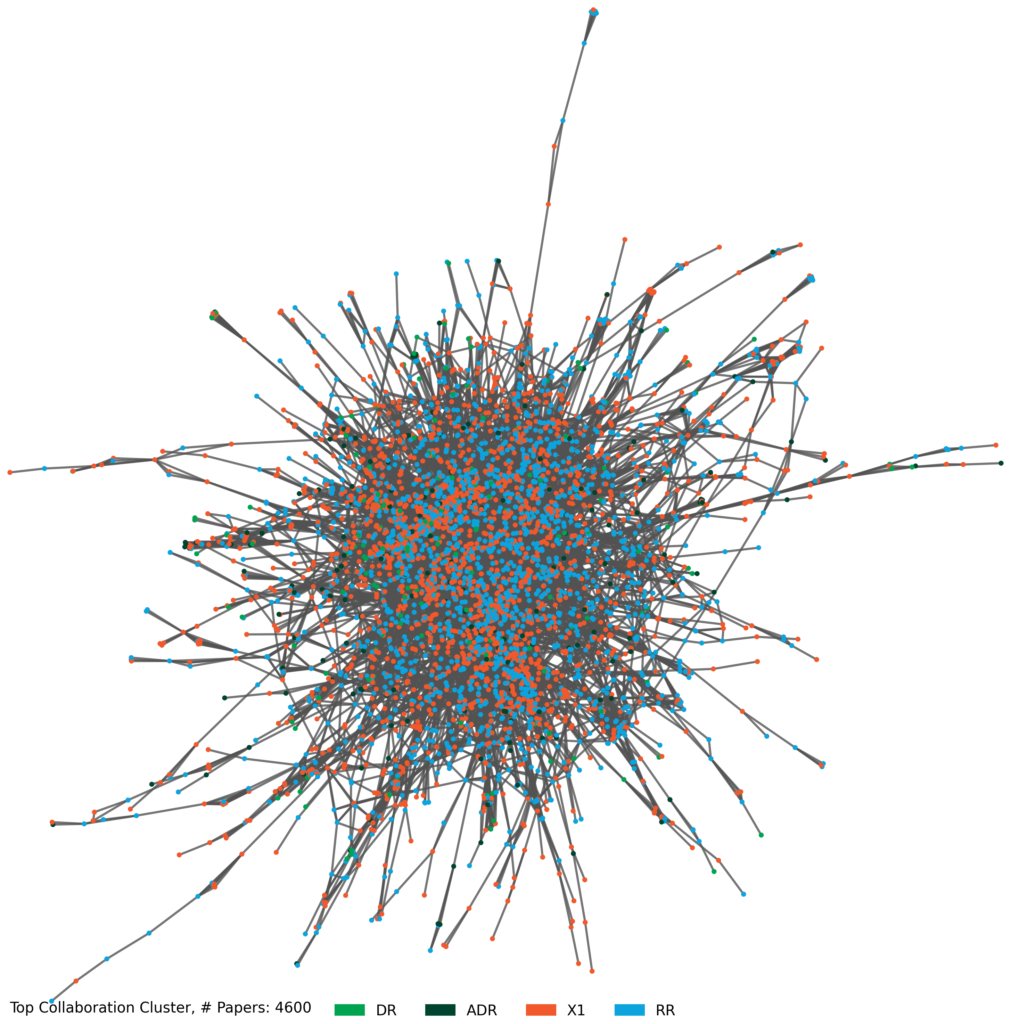
Authorship-Based Relationships Between Submissions
Next, we look into clusters of paper authors connected by authorship in other papers. We found that 1076 papers are not connected to any other papers, and thus, for no clusters. Another 1049 papers form 365 clusters; all clusters formed from more than 2 papers are visualized in Figure 11. Finally, the largest cluster is based on 4600 papers that are all connected by at least one author. The cluster is visualized in Figure 12. To give perspective on the clusters, they are colored by the Round 1 Outcomes.
| Country | Alpha-3 | Unique Authors | Normalized Authors | Normalized GDP Papers | Normalized Population Papers |
|---|---|---|---|---|---|
| Argentina | ARG | 3.0 | 0.4 | 0.5 | 0.01 |
| Australia | AUS | 664.0 | 220.0 | 120.3 | 7.99 |
| Austria | AUT | 194.5 | 63.5 | 112.2 | 6.89 |
| Azerbaijan | AZE | 0.5 | 0.1 | 1.3 | 0.01 |
| Bangladesh | BGD | 130.5 | 32.2 | 67.7 | 0.19 |
| Belgium | BEL | 73.0 | 21.3 | 29.7 | 1.79 |
| Bhutan | BTN | 2.0 | 0.4 | 132.0 | 0.57 |
| Brazil | BRA | 111.5 | 30.2 | 13.4 | 0.14 |
| Canada | CAN | 844.5 | 332.1 | 145.4 | 7.97 |
| Chile | CHL | 4.0 | 1.1 | 3.1 | 0.05 |
| China | CHN | 3734.2 | 1053.1 | 54.3 | 0.75 |
| Colombia | COL | 5.5 | 1.5 | 3.5 | 0.03 |
| Costa Rica | CRI | 7.5 | 3.1 | 30.3 | 0.6 |
| Croatia | HRV | 1.0 | 0.3 | 3.2 | 0.09 |
| Cyprus | CYP | 29.5 | 9.4 | 236.6 | 9.78 |
| Czechia | CZE | 24.5 | 7.2 | 18.8 | 0.66 |
| Denmark | DNK | 269.0 | 99.4 | 216.3 | 16.51 |
| Ecuador | ECU | 1.5 | 0.5 | 4.1 | 0.03 |
| Egypt | EGY | 7.5 | 3.0 | 8.7 | 0.03 |
| Eritrea | ERI | 1.0 | 0.3 | 146.5 | 0.09 |
| Estonia | EST | 13.5 | 6.6 | 140.4 | 4.79 |
| Ethiopia | ETH | 2.0 | 0.4 | 3.7 | 0.0 |
| Finland | FIN | 246.0 | 95.6 | 303.8 | 16.9 |
| France | FRA | 251.5 | 83.5 | 24.8 | 1.22 |
| Germany | DEU | 1401.2 | 480.0 | 95.7 | 5.75 |
| Ghana | GHA | 6.0 | 2.1 | 18.8 | 0.06 |
| Greece | GRC | 17.0 | 4.9 | 17.3 | 0.47 |
| Greenland | GRL | 1.0 | 0.3 | 100.2 | 5.87 |
| Hong Kong | HKG | 130.0 | 56.1 | 130.9 | 7.45 |
| Hungary | HUN | 2.0 | 0.5 | 2.0 | 0.05 |
| Iceland | ISL | 0.5 | 0.2 | 6.5 | 0.64 |
| India | IND | 307.0 | 93.0 | 22.5 | 0.07 |
| Indonesia | IDN | 4.5 | 0.7 | 0.5 | 0.0 |
| Iran (Islamic Republic of) | IRN | 9.0 | 3.0 | 8.5 | 0.04 |
| Iraq | IRQ | 2.0 | 1.0 | 3.8 | 0.02 |
| Ireland | IRL | 112.0 | 36.2 | 51.1 | 6.63 |
| Israel | ISR | 71.5 | 22.4 | 36.6 | 2.2 |
| Italy | ITA | 233.8 | 67.7 | 26.6 | 1.15 |
| Japan | JPN | 586.5 | 187.1 | 43.7 | 1.52 |
| Kazakhstan | KAZ | 1.0 | 0.2 | 0.6 | 0.01 |
| Kenya | KEN | 21.5 | 2.5 | 18.3 | 0.05 |
| Korea, Republic of | KOR | 1042.3 | 365.9 | 196.9 | 7.15 |
| Kuwait | KWT | 0.5 | 0.1 | 0.8 | 0.03 |
| Liechtenstein | LIE | 1.5 | 0.8 | 79.6 | 18.34 |
| Lithuania | LTU | 2.0 | 0.2 | 2.6 | 0.09 |
| Luxembourg | LUX | 27.8 | 9.4 | 93.6 | 13.81 |
| Macao | MAC | 12.5 | 4.8 | 91.0 | 6.69 |
| Malawi | MWI | 2.0 | 0.4 | 25.2 | 0.02 |
| Malaysia | MYS | 25.5 | 7.1 | 15.1 | 0.21 |
| Malta | MLT | 1.0 | 0.2 | 6.0 | 0.29 |
| Mexico | MEX | 19.5 | 6.3 | 3.4 | 0.05 |
| Namibia | NAM | 1.0 | 0.2 | 17.0 | 0.08 |
| Nepal | NPL | 7.0 | 0.5 | 11.0 | 0.02 |
| Netherlands | NLD | 366.5 | 120.1 | 91.0 | 6.63 |
| New Zealand | NZL | 82.0 | 31.7 | 120.6 | 5.94 |
| Nigeria | NGA | 8.5 | 1.6 | 5.8 | 0.01 |
| Norway | NOR | 45.0 | 14.5 | 28.0 | 2.58 |
| Pakistan | PAK | 41.0 | 9.6 | 23.3 | 0.04 |
| Palestine, State of | PSE | 1.0 | 0.2 | 14.6 | 0.04 |
| Peru | PER | 4.0 | 0.4 | 1.2 | 0.01 |
| Philippines | PHL | 11.0 | 3.6 | 7.3 | 0.03 |
| Poland | POL | 74.5 | 19.3 | 18.6 | 0.52 |
| Portugal | PRT | 172.5 | 54.6 | 161.5 | 5.08 |
| Qatar | QAT | 11.5 | 3.3 | 15.1 | 1.05 |
| Romania | ROU | 7.0 | 4.4 | 10.4 | 0.23 |
| Russian Federation | RUS | 27.0 | 10.9 | 4.3 | 0.07 |
| Rwanda | RWA | 5.0 | 1.3 | 90.3 | 0.09 |
| Saudi Arabia | SAU | 25.5 | 9.2 | 7.3 | 0.26 |
| Serbia and Montenegro* | SCG | 4.0 | 1.2 | ||
| Singapore | SGP | 275.0 | 91.1 | 158.7 | 14.91 |
| Slovakia | SVK | 4.0 | 1.0 | 6.5 | 0.18 |
| South Africa | ZAF | 22.0 | 3.6 | 8.4 | 0.06 |
| Spain | ESP | 158.5 | 48.8 | 25.8 | 0.99 |
| Sri Lanka | LKA | 6.0 | 1.5 | 15.1 | 0.07 |
| Sweden | SWE | 211.8 | 85.1 | 128.5 | 8.02 |
| Switzerland | CHE | 306.8 | 103.7 | 103.5 | 11.42 |
| Taiwan, Province of China | TWN | 263.5 | 78.2 | 88.4 | 3.35 |
| Thailand | THA | 16.5 | 4.3 | 7.6 | 0.06 |
| Tunisia | TUN | 8.0 | 4.5 | 75.9 | 0.37 |
| Turkey | TUR | 19.5 | 7.8 | 5.0 | 0.09 |
| Uganda | UGA | 9.5 | 0.7 | 11.1 | 0.02 |
| Ukraine | UKR | 2.0 | 0.5 | 2.4 | 0.02 |
| United Arab Emirates | ARE | 23.0 | 6.5 | 11.4 | 0.57 |
| United Kingdom of Great Britain and Northern Ireland | GBR | 1376.0 | 463.3 | 117.0 | 6.69 |
| United States of America | USA | 6616.0 | 2114.9 | 69.1 | 6.22 |
| Uruguay | URY | 9.0 | 1.4 | 16.9 | 0.41 |
| Viet Nam | VNM | 12.0 | 2.7 | 5.6 | 0.03 |