By Sven Mayer, Guo Freeman, and Cristina Zaga.
In our previous blog post, we shared details about the papers track first round outcomes, where Desk Reject (DR) and Assisted Desk Reject (ADR) decisions were presented together with X1 (rejected after the first round review) as rejections. In this blog post, we provide further statistics about the DR/ADR decisions.
CHI 2026 DR and ADR Process
Besides the traditional desk reject (DR) policy, CHI 2026 introduced an assisted desk rejection (ADR) method, as outlined in the blog post “Revised CHI 2026 Papers Desk Reject Process.”
Overall DR and ADR Decisions
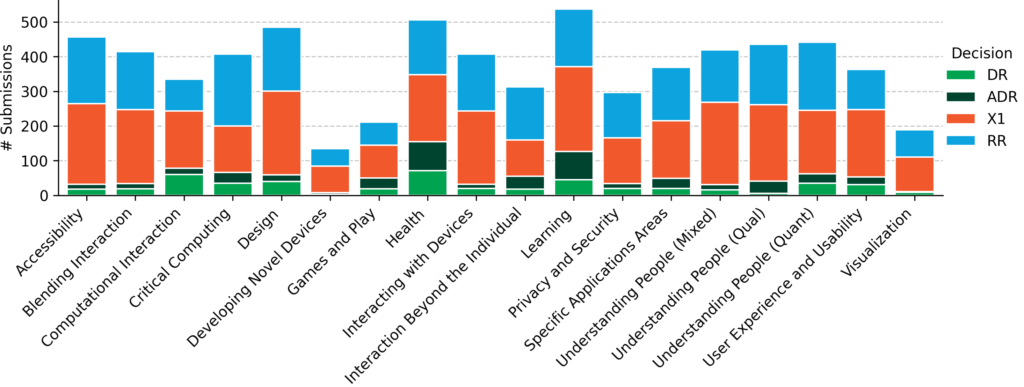
Figure 1 presents the percentage of DR, ADR, RR (Revise and Resubmit), and X1 (rejection in the first round of review) decisions per subcommittee. Overall, all subcommittees made DR decisions, ranging from 1.4% (6 out of 436 submissions, Understanding People – Qualitative) to 17.9% (60 out of 335 submissions, Computational Interaction). All subcommittees also made ADR decisions, ranging from 1.1% (2 out of 189 submissions, Visualization) to 16.6% (84 out of 506 submissions, Health). The absolute numbers are shown in Figure 2.

Desk Rejections Reasons
As outlined in the blog post Revised CHI 2026 Papers Desk Reject Process, CHI 2026 employed the following reasons for Desk Rejection:
- DR Length: incorrect length judgments or unacceptable length justification.
- DR Anonymous: anonymization issues, e.g., revealing author identity or affiliation, referring to one’s own prior work in the wrong way (e.g., any references marked “anonymous” are grounds for desk rejection), see CHI Anonymization Policy.
- DR Template: clearly out of format, e.g., double column, extended abstract. We can be lenient with minor format mismatches, such as incorrect fonts or citation formats.
- DR Incomplete: missing major sections, etc., not a finished paper
- DR Dual: failure to declare concurrent submissions, or the paper has been submitted in parallel to another conference.
- DR Plagiarism: based on ACM plagiarism detection and/or deliberations from ACs.
- DR Scope: out of scope of the conference – may be completely evident or not about HCI (more of a judgment call).
- DR MISC: for anything else, and not written in English, unfinished/sloppy, unjustified/undisclosed LLM use.
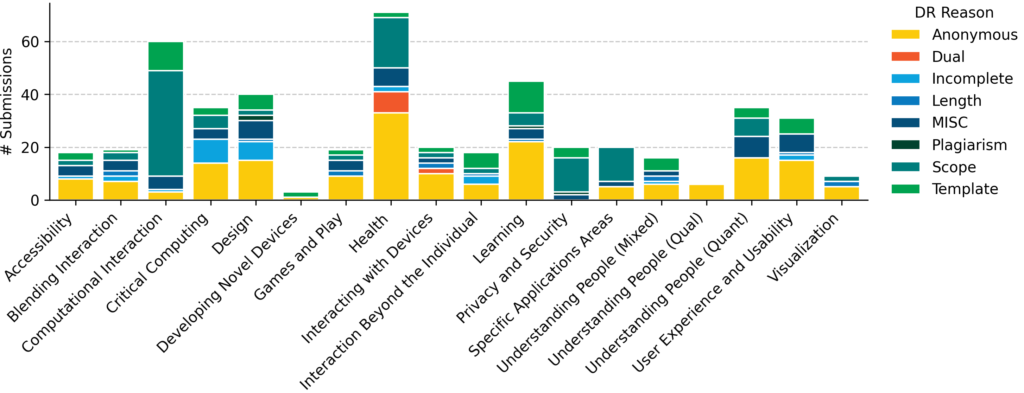
Figure 3 presents the number of desk-rejected papers per subcommittee and per DR reason, and Figure 4 visualizes the percentage of desk-rejected papers per subcommittee and per DR reason; also see Table 1. While different subcommittees tended to desk reject submissions for various reasons, DR Scopewas the most frequently cited reason for DR in Computational Interaction, Privacy and Security, and Specific Applications Areas; and all DR decisions in Understanding People-Qualitative were DR Anonymous.

| Total [N] | Anonymous [%] | Dual [%] | Incomplete [%] | Length [%] | MISC [%] | Plagiarism [%] | Scope [%] | Template [%] | |
|---|---|---|---|---|---|---|---|---|---|
| Accessibility | 18 | 44.4 | 0.0 | 5.6 | 0.0 | 22.2 | 0.0 | 11.1 | 16.7 |
| Blending Interaction | 19 | 36.8 | 0.0 | 10.5 | 10.5 | 21.1 | 0.0 | 15.8 | 5.3 |
| Computational Interaction | 60 | 5.0 | 0.0 | 1.7 | 0.0 | 8.3 | 0.0 | 66.7 | 18.3 |
| Critical Computing | 35 | 40.0 | 0.0 | 25.7 | 0.0 | 11.4 | 0.0 | 14.3 | 8.6 |
| Design | 40 | 37.5 | 0.0 | 17.5 | 2.5 | 17.5 | 5.0 | 5.0 | 15.0 |
| Developing Novel Devices | 3 | 33.3 | 0.0 | 0.0 | 0.0 | 0.0 | 0.0 | 0.0 | 66.7 |
| Games and Play | 19 | 47.4 | 0.0 | 0.0 | 10.5 | 21.1 | 0.0 | 10.5 | 10.5 |
| Health | 71 | 46.5 | 11.3 | 2.8 | 0.0 | 9.9 | 0.0 | 26.8 | 2.8 |
| Interacting with Devices | 20 | 50.0 | 10.0 | 0.0 | 10.0 | 10.0 | 0.0 | 10.0 | 10.0 |
| Interaction Beyond the Individual | 18 | 33.3 | 0.0 | 16.7 | 5.6 | 0.0 | 0.0 | 11.1 | 33.3 |
| Learning | 45 | 48.9 | 0.0 | 0.0 | 2.2 | 8.9 | 2.2 | 11.1 | 26.7 |
| Privacy and Security | 20 | 0.0 | 0.0 | 0.0 | 0.0 | 10.0 | 5.0 | 65.0 | 20.0 |
| Specific Applications Areas | 20 | 25.0 | 0.0 | 0.0 | 0.0 | 10.0 | 0.0 | 65.0 | 0.0 |
| Understanding People (Mixed) | 16 | 37.5 | 0.0 | 6.2 | 12.5 | 12.5 | 0.0 | 0.0 | 31.2 |
| Understanding People (Qual) | 6 | 100.0 | 0.0 | 0.0 | 0.0 | 0.0 | 0.0 | 0.0 | 0.0 |
| Understanding People (Quant) | 35 | 45.7 | 0.0 | 0.0 | 0.0 | 22.9 | 0.0 | 20.0 | 11.4 |
| User Experience and Usability | 31 | 48.4 | 0.0 | 6.5 | 3.2 | 22.6 | 0.0 | 0.0 | 19.4 |
| Visualization | 9 | 55.6 | 0.0 | 0.0 | 22.2 | 0.0 | 0.0 | 22.2 | 0.0 |
Assisted Desk Rejections Reasons
As outlined in the blog post Revised CHI 2026 Papers Desk Reject Process, CHI 2026 employs the following reasons for ADR:
- ADR-Context: Grossly insufficient literature review to contextualize the contribution.
- ADR-Contribution: A disproportionately small HCI contribution given the paper length.
- ADR-Data: Grossly insufficient data to support claims.
- ADR-Method: Grossly insufficient methodological detail, conceptual clarity, or research transparency.
Figure 5 presents the number of assisted desk rejected papers per subcommittee and per ADR reason, and Figure 6 visualizes the percentage of assisted desk rejected papers per subcommittee and per ADR reason. While different subcommittees tended to make ADR decisions for various reasons, ADR-Context was the most frequently cited reason for ADR in almost all subcommittees, as shown in Table 2. ADR-Contribution was also one of the more frequently cited ADR reasons.


| Total [N] | Context [%] | Contribution [%] | Data [%] | Method [%] | |
|---|---|---|---|---|---|
| Accessibility | 14 | 57.1 | 28.6 | 14.3 | 0.0 |
| Blending Interaction | 15 | 53.3 | 13.3 | 6.7 | 26.7 |
| Computational Interaction | 18 | 66.7 | 22.2 | 5.6 | 5.6 |
| Critical Computing | 31 | 38.7 | 38.7 | 3.2 | 19.4 |
| Design | 19 | 36.8 | 15.8 | 0.0 | 47.4 |
| Developing Novel Devices | 5 | 60.0 | 40.0 | 0.0 | 0.0 |
| Games and Play | 31 | 58.1 | 16.1 | 0.0 | 25.8 |
| Health | 84 | 47.6 | 44.0 | 1.2 | 7.1 |
| Interacting with Devices | 12 | 50.0 | 50.0 | 0.0 | 0.0 |
| Interaction Beyond the Individual | 37 | 40.5 | 45.9 | 0.0 | 13.5 |
| Learning | 82 | 39.0 | 40.2 | 7.3 | 13.4 |
| Privacy and Security | 14 | 35.7 | 28.6 | 21.4 | 14.3 |
| Specific Applications Areas | 29 | 55.2 | 27.6 | 6.9 | 10.3 |
| Understanding People (Mixed) | 15 | 80.0 | 13.3 | 0.0 | 6.7 |
| Understanding People (Qual) | 35 | 8.6 | 85.7 | 2.9 | 2.9 |
| Understanding People (Quant) | 27 | 81.5 | 14.8 | 0.0 | 3.7 |
| User Experience and Usability | 22 | 68.2 | 27.3 | 0.0 | 4.5 |
| Visualization | 2 | 50.0 | 0.0 | 0.0 | 50.0 |