By Sven Mayer and Guo Freeman
In this blog, we provide insights into the papers track outcomes after the CHI 2026 Program Committee (PC) meeting, which took place from January 12–14, 2026. As a reminder, after the first round of reviews, 2,603 submissions were invited to submit revisions. Of these invited resubmissions, 2,576 were resubmitted (27 were withdrawn or not resubmitted). Please refer to the previous blog post for an analysis of the Papers Track First Round Outcomes. External reviewers and Associate Chairs (ACs) asynchronously reviewed and discussed these revised submissions and made individual accept/reject decisions. In this process, another 11 papers were identified as violating CHI policies (e.g., violating CHI’s policy on anonymization) and were therefore rejected. The remaining 2,565 (98.5%) resubmissions from round 2 were then discussed within subcommittees during synchronous virtual PC meetings, where final accept/reject decisions were made.
Overall Acceptance Rates
Of the initial 6,730 completed submissions, the CHI 2026 Program Committee has conditionally accepted 1,705 submissions after two rounds of review. The overall acceptance rate for the Papers track was 25.3% of completed submissions. Of the submissions that were revised and resubmitted, 65.5% were accepted. These outcomes largely align with previous years. As shown in this blog post, the overall acceptance rate in 2025 was 24.9%, and 64.6% of the revised and resubmitted papers were accepted.
Acceptance Rates by Paper Length
Regarding length, most papers submitted to CHI 2026 are categorized as “standard” length (between 5,000 and 12,000 words; averaging 7,000-8,000 words), and they have the highest acceptance rate (26.65%). “Excessively long” papers (over 12,000 words) have a slightly lower acceptance rate of 22.41%, while short papers (under 5,000 words) have the lowest acceptance rate of 11.2%. See Table 1 for details.
| Paper Length | Total Count | Rejected | Accepted | % Accepted |
|---|---|---|---|---|
| Short | 555 | 493 | 62 | 11.17 |
| Standard | 6117 | 4487 | 1630 | 26.65 |
| Excessive | 58 | 45 | 13 | 22.41 |
| Total | 6730 | 5025 | 1705 | 25.30 |
Acceptance Rates By Subcommittee
Submissions to the CHI Papers track are made to one of eighteen subcommittees. In our previous blog post, we discussed submission rates and the distribution of rejection (X1) and revise and resubmit (RR) decisions in the first round. The final range of acceptance rates was between 15.8% (Computational Interaction) and 33.6% (Critical Computing). Figure 1 shows the acceptance rates for each subcommittee.
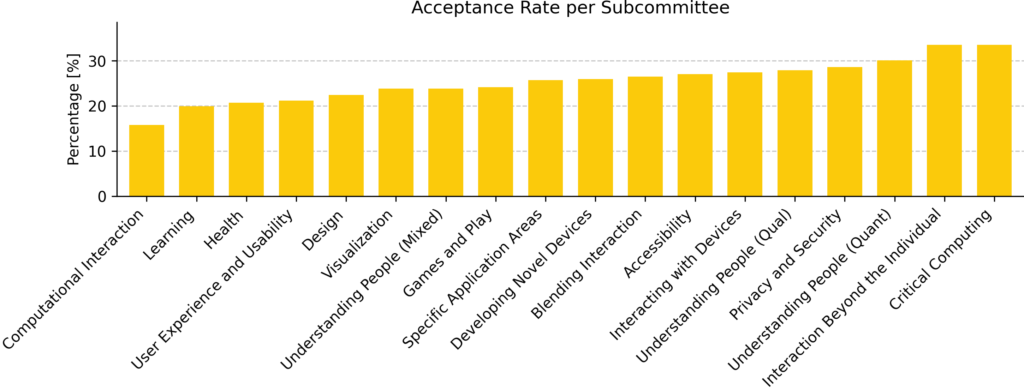
| Total Count | # Rejected in Round 2 | % Accepted in Round 2 | Overall # Rejected | Overall # Accepted | Overall % Accepted | |
|---|---|---|---|---|---|---|
| Computational Interaction | 336 | 38 | 58.2 | 283 | 53 | 15.8 |
| Learning | 537 | 58 | 64.8 | 430 | 107 | 19.9 |
| Health | 507 | 51 | 67.3 | 402 | 105 | 20.7 |
| User Experience and Usability | 363 | 38 | 67.0 | 286 | 77 | 21.2 |
| Design | 485 | 72 | 60.2 | 376 | 109 | 22.5 |
| Visualization | 189 | 33 | 57.7 | 144 | 45 | 23.8 |
| Understanding People (Mixed) | 420 | 47 | 68.0 | 320 | 100 | 23.8 |
| Games and Play | 211 | 13 | 79.7 | 160 | 51 | 24.2 |
| Specific Application Areas | 369 | 57 | 62.5 | 274 | 95 | 25.7 |
| Developing Novel Devices | 135 | 13 | 72.9 | 100 | 35 | 25.9 |
| Blending Interaction | 415 | 55 | 66.7 | 305 | 110 | 26.5 |
| Accessibility | 458 | 64 | 66.0 | 334 | 124 | 27.1 |
| Interacting with Devices | 408 | 50 | 69.1 | 296 | 112 | 27.5 |
| Understanding People (Qual) | 437 | 52 | 70.1 | 315 | 122 | 27.9 |
| Privacy and Security | 297 | 44 | 65.9 | 212 | 85 | 28.6 |
| Understanding People (Quant) | 442 | 63 | 67.9 | 309 | 133 | 30.1 |
| Interaction Beyond the Individual | 313 | 46 | 69.5 | 208 | 105 | 33.5 |
| Critical Computing | 408 | 66 | 67.5 | 271 | 137 | 33.6 |
| Total | 6730 | 860 | 66.5 | 5025 | 1705 | 25.3 |
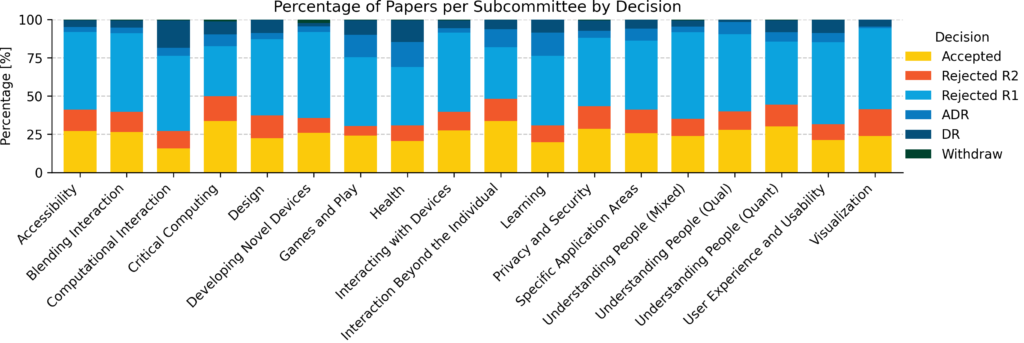
However, it is important to consider desk rejections (DR) and assisted desk rejections (ADR) when approaching these outcomes, as some subcommittees might have more DR and ADR decisions than others, which would skew the acceptance rate. Figure 2 shows the breakdown of all decisions across all 18l subcommittees. For instance, Computational Interaction has the lowest acceptance rate while having the highest desk rejection rate. See further insights into this in our blog post on (Assisted) Desk Rejections.
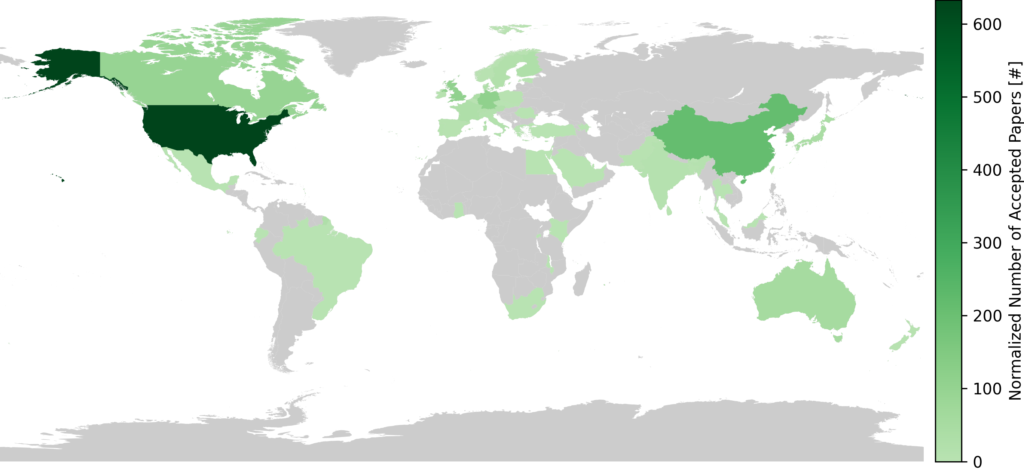
Acceptance Rates by Geographical Distribution and Relative
Built on our earlier analysis of Insights Into Submitting Authors of the Papers Track, we now turn to the geographical distribution of author affiliations of accepted papers. For this, we apply the same normalization to account for multi-country papers and authors who have affiliations in more than one country. Figure 3 visualizes the number of accepted papers per country.
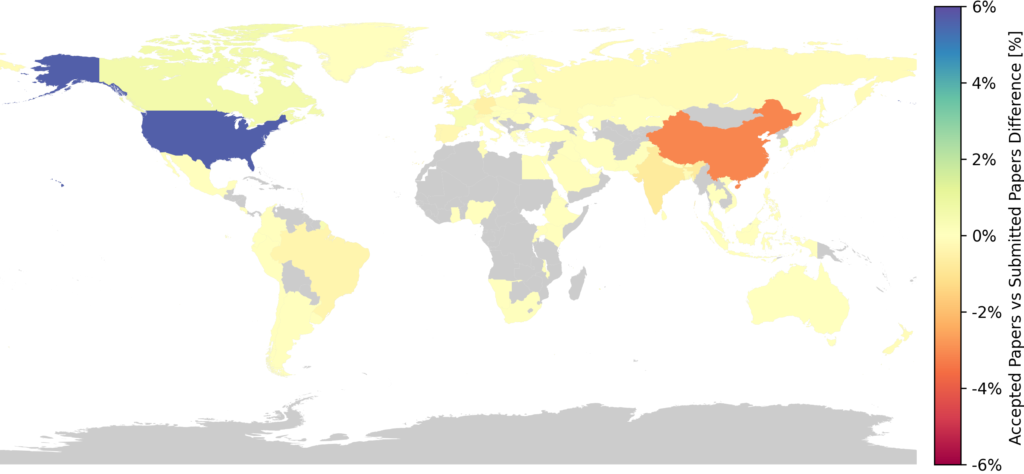
Also built on our earlier analysis of Insights Into Submitting Authors of the Papers Track, we further examine how submission patterns relate to acceptance outcomes across different countries. Using affiliation data from submitted papers, we analyze whether authors from different regions are accepted at rates that are proportional to their submission volumes.
Based on this data, we compute the relative acceptance rate for each country by comparing its share of accepted papers to its share of submitted papers. Figure 4 visualizes these differences. Countries whose submissions are accepted at a higher-than-average rate appear with positive values (blue), indicating stronger-than-average outcomes. In contrast, countries whose acceptance rates fall below the overall average are shown with negative values (red).
This visualization highlights how closely submission activity and acceptance outcomes align across regions, and where notable deviations occur. It provides a high-level view of geographical patterns in publication success and offers insights into the global distribution of published work. For example, submissions from the United States show a positive deviation of 5.6 percentage points. While authors affiliated with U.S. institutions submitted 31.5% of all papers, they accounted for 37.1% of accepted submissions. This indicates a higher-than-average acceptance rate relative to their submission volume.
In contrast, submissions from China exhibit a negative deviation of 3.1 percentage points. Chinese authors contributed 15.7% of all submissions, but represented only 12.5% of accepted papers. This reflects a lower-than-average acceptance rate compared to their share of submissions.
These examples illustrate how differences between submission and acceptance proportions can reveal systematic patterns in publication outcomes across regions. At the same time, such aggregate statistics should be interpreted with care, as they are influenced by many factors, including submission volume, topical focus, and institutional support structures.
Reviewer Recommendations
Reviewer recommendations in the second round review of the CHI Papers track are provided as categorical judgments, typically in the form of “accept” or “reject.” While these recommendations may resemble scores, they are not numerical ratings and therefore cannot be meaningfully averaged in their original form. At the same time, submissions often receive different numbers of reviews (e.g., not all revised and resubmitted papers received four recommendations from four reviewers: 1AC, 2AC, and two external reviewers), making direct comparisons based on raw counts difficult.
To enable a quantitative analysis, we first transformed these categorical recommendations into a normalized numerical score. Specifically, we mapped rejection recommendations (R) to a value of 1 and acceptance recommendations (A) to a value of 5. For each submission, we then computed an aggregate recommendation score by averaging these values across all reviewers.
This analysis yields a score ranging from 1 (unanimous rejection) to 5 (unanimous acceptance), with intermediate values indicating mixed evaluations. For example, a submission that receives three accept recommendations and one reject recommendation obtains a score of 4.0, while an evenly split decision corresponds to a score of 3.0. Importantly, this metric remains comparable regardless of whether a paper was reviewed by three, four, or five reviewers.
Using this aggregate recommendation score, we analyze how levels of reviewer support relate to final paper decisions. Figure 5 shows how accepted and rejected papers are distributed across the 1-5 scale, and where thresholds and gray areas tend to emerge in the review process.
