By Sven Mayer, Guo Freeman, and Cristina Zaga.
As the resubmission phase at CHI 2026 has wrapped up, we wrote this blog post to provide insights into the papers track first round outcomes, including: how many papers were submitted to CHI 2026 and how many papers were entered into the second round of reviewing in December 2025. This post primarily focuses on Round 1 outcomes, with Desk Reject (DR) and Assisted Desk Reject (ADR) decisions presented as rejections. We will provide further statistics about the DR/ADR decisions and Round 2 outcomes in separate blogs.
Increase in Submissions
Overall, we saw an increase in submissions to CHI 2026’s Papers track. This year, we received 6,730 complete submissions (6,725 without withdrawn papers as of today). This represents a significant increase compared to 2025 (5,014, increase of 34%), 2024 (4,046, increase of 66%), and 2023 (3,182, increase of 57%).
Subcommittee Load
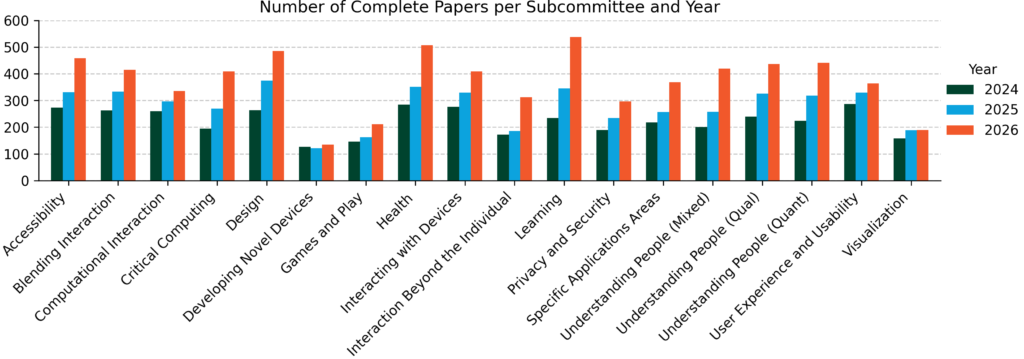
Submissions to the CHI Papers track are made to one of eighteen subcommittees. These subcommittees have a topic focus (e.g., Health, Design, User Experience, Games & Play). Figure 1 summarizes the number of submissions made to the subcommittees in 2026.

Overall, the number of completed submissions to all subcommittees increased in 2026 compared to 2025. Figure 2 provides further insight into the growth of the subcommittees. Figure 2 indicates that all subcommittees show a significant increase in submissions, but for two (Developing Novel Devices, and Visualization). The number of submissions to both has been relatively stable over the last 3 years.
Review Scales
Before we discuss the outcome, here is a reminder of the scales used during the CHI 2026 review process. Reviewers and ACs provide a recommendation (recommendation category out of 5 choices) and can further contextualize their recommendation based on originality, significance, and research quality (each a 5-point ordinal scale from Very Low, Low, Medium, High, and Very High). However, the decision to qualify for a Revise and Resubmit depends on whether one of the ACs (1AC or 2AC) recommends a Revise and Resubmit (RR) or higher ratings (A or ARR).
| Short Name | Name On Review Form | Threshold for Revise & Resubmit |
|---|---|---|
| A | I recommend Accept with Mi in nor Revisions | Yes |
| ARR | I can go with either Accept with Minor Revisions orRevise and Resubmit | Yes |
| RR | I recommend Revise and Resubmit | Yes |
| RRX | I can go with either Reject or Revise and Resubmit | No |
| X | I recommend Reject | No |
Decision (After Round 1 Review)
Of all the completed submissions, including the Desk Rejects (DR), for 2026, 4,122 (61.3%) papers were Rejected (X1) after the first round of review, and 2,603 (38.7%) were invited to the Revise & Resubmit (RR) round. For comparison, in 2024, 40.4% of papers moved into RR, and in 2025, 39.3%. Figure 3 shows the differences between the subcommittees, and Table 1 presents all RR rates. Overall, the RR rate ranges between 27.46% (Computational Interaction) and 50.98% (Critical Computing).

| Subcommittee | Total Count | # Rejected | # Moving To RR | % Moving To RR |
|---|---|---|---|---|
| Accessibility | 458 | 265 | 192 | 41.9 |
| Blending Interaction | 415 | 247 | 168 | 40.5 |
| Computational Interaction | 336 | 243 | 92 | 27.4 |
| Critical Computing | 408 | 200 | 208 | 51.0 |
| Design | 485 | 301 | 184 | 37.9 |
| Developing Novel Devices | 135 | 84 | 51 | 37.8 |
| Games and Play | 211 | 145 | 66 | 31.3 |
| Health | 507 | 348 | 158 | 31.2 |
| Interacting with Devices | 408 | 243 | 164 | 40.2 |
| Interaction Beyond the Individual | 313 | 160 | 153 | 48.9 |
| Learning | 537 | 371 | 166 | 30.9 |
| Privacy and Security | 297 | 166 | 131 | 44.1 |
| Specific Applications Areas | 369 | 215 | 154 | 41.7 |
| Understanding People (Mixed) | 420 | 269 | 151 | 36.0 |
| Understanding People (Qual) | 437 | 262 | 174 | 39.8 |
| Understanding People (Quant) | 442 | 245 | 197 | 44.6 |
| User Experience and Usability | 363 | 247 | 116 | 32.0 |
| Visualization | 189 | 111 | 78 | 41.3 |
| Total | 6730 | 4122 | 2603 | 38.7 |
Overview Review Scores
Figure 4 displays a histogram of submissions based on the overall score after the first round of reviews, along with the corresponding decision. As DR and ADR do not get a score, they are excluded from this chart.
This year, at last, one associate chair needs to give an RR and above for papers to go into the second round.

Outcomes Based on Submission Length
As in previous years, this year’s Papers track will continue to feature different submission length categories. Submitted papers are divided into three categories: Short (under 5,000 words), Standard (between 5,000 and 12,000 words; averaging 7,000-8,000 words), and Excessive (over 12,000 words). Table 2 provides a summary of submissions by type, detailing the number of papers submitted and their outcomes. For simplicity, this table provides a summary of reviewed papers (excluding desk rejections) that received either a “Revise & Resubmit” or “Reject” decision.
| Paper Length | Total Count | # Rejected | # Moving To RR | % Moving To RR |
|---|---|---|---|---|
| Short | 555 | 457 | 98 | 17.66 |
| Standard | 6117 | 3625 | 2487 | 40.66 |
| Excessive | 58 | 40 | 18 | 31.03 |
| Total | 6730 | 4122 | 2603 | 38.70 |